
Why Nobody Opens the Dashboard
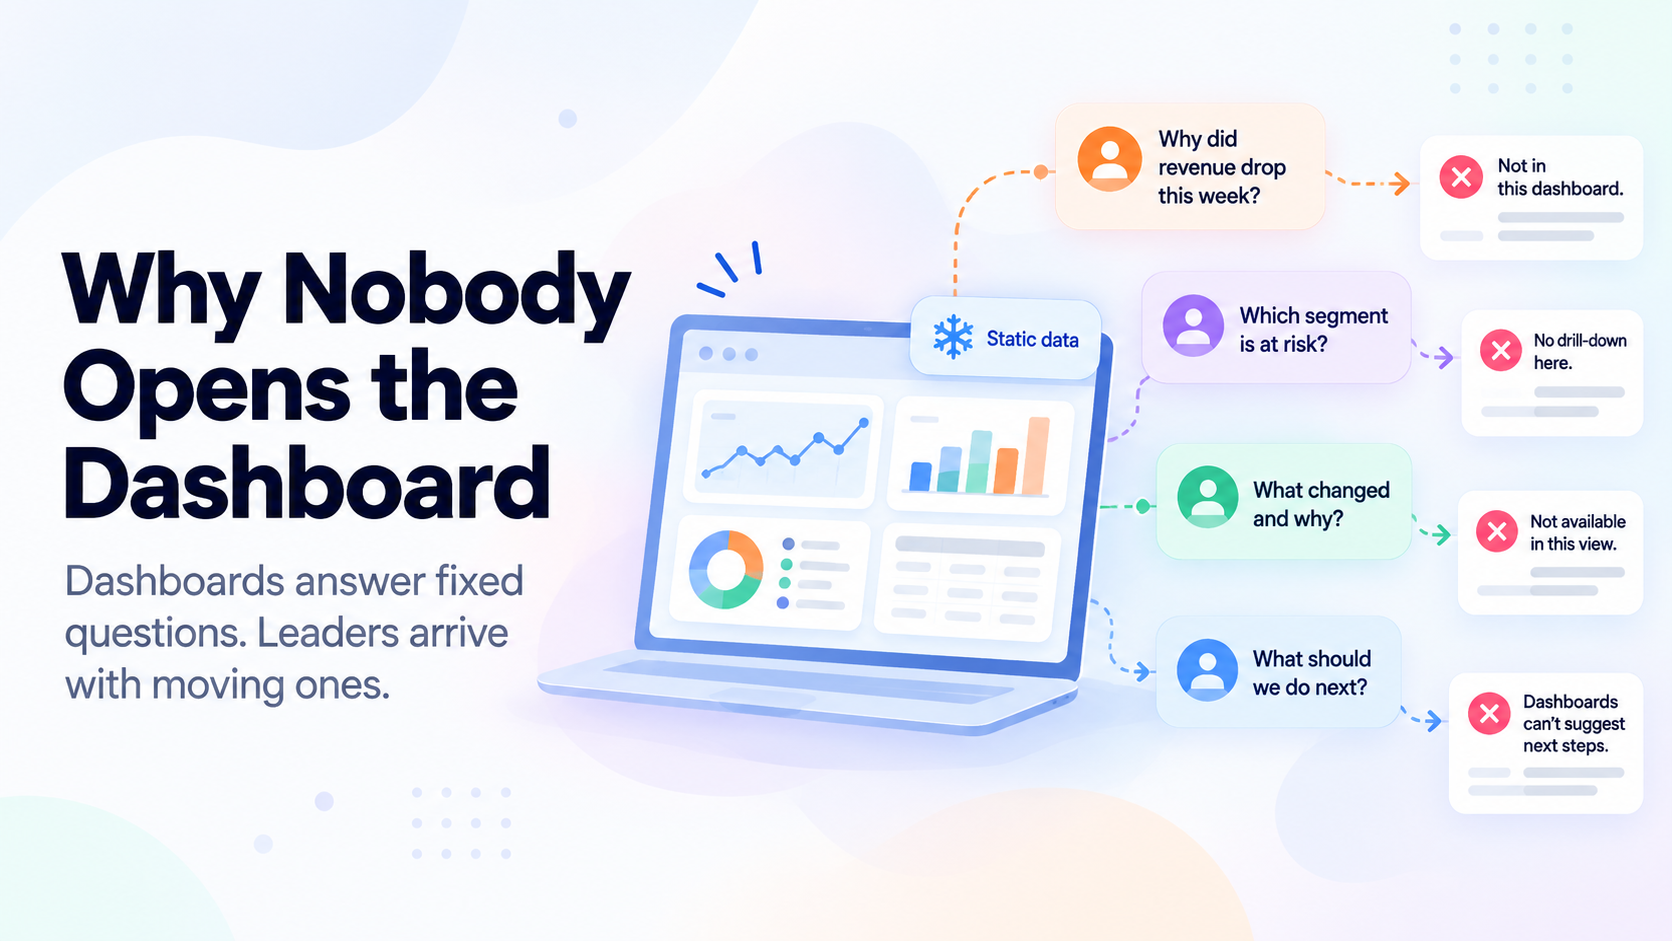
Dashboards go unopened because they answer questions nobody is currently asking. A dashboard is built once, around metrics agreed in a workshop, and then waits. Leaders arrive with changing questions, find a fixed set of charts, and stop coming back. The problem is not design or adoption. It is that the dashboard cannot respond.
- Dashboard abandonment is close to universal and is usually misdiagnosed as a training or design failure.
- A dashboard answers the questions that were current on the day it was specified. Questions move; the dashboard does not.
- Charts report state. Leaders need to understand change and cause, which a chart cannot supply.
- The usual fix, adding more charts, makes the problem worse by raising the cost of looking.
- Dashboards remain excellent for monitoring a known process. They were never suited to leadership enquiry.
The Pattern Everyone Recognises
A CX dashboard project runs a familiar course. Workshops to agree the metrics. Weeks of data engineering. A launch with real enthusiasm. Heavy use for a fortnight.
Then the curve bends. By week six, two people open it, both of them analysts. By quarter end, leadership is asking for the numbers in email again. Someone proposes a redesign, and the cycle restarts with new colours.
The standard explanations are adoption, training and user experience. Each gets budget. None of them fixes it, because the issue is upstream of all three.
“It always could. But nobody ever asked it. Because somewhere along the way, we decided that CX was operations.”
A dashboard is a frozen set of answers to questions that were live on the day it was specified. Business questions are not frozen. By the time it ships, leadership has moved to a new concern, and a fixed chart has no way to follow.
Three Structural Reasons It Fails for Leaders
It reports state, and leaders need cause. A chart can show CSAT at 72, down from 78. It cannot tell you that the drop sits in one city, among customers who bought a specific product, and traces to a fulfilment change made six weeks ago. That is a reasoning task across several systems. A visualisation cannot perform it; it can only invite someone to go and do it manually.
It cannot take a follow-up. This is the deepest limitation. Every useful enquiry is a chain. Why is NPS down. Which segment. What are they saying. Is it one issue or several. A dashboard answers the first and stops. The remaining four become a request to an analyst and a three-day wait, which is longer than the decision window.
It is organised around what is measurable, not around what is important. Dashboards are assembled from fields that exist in a schema. The most consequential thing about your customers this month is probably in sentences, not fields: a phrase appearing in a new way, a comparison customers are starting to make, a tone shift in a segment. None of it fits a chart, so none of it appears.
The Fix That Makes It Worse
The common response to a dashboard nobody opens is to add to it. More views. More filters. More tabs for more teams.
This raises the cost of looking without raising the value of looking. A leader with eleven minutes between meetings now faces forty charts and no idea which three matter today. Rational response: close the tab and ask a human.
The deeper error is that this treats a reasoning problem as a display problem. The leader does not need the data presented differently. They need something to have read it, worked out what changed and why, and said so.
What Actually Replaces It
Not a better dashboard. A different interaction.
Ask in plain language. The leader describes the question in their own words, including follow-ups, and gets an answer with evidence rather than a view to interpret. Nothing needs to have been configured in advance, which is what lets the question move.
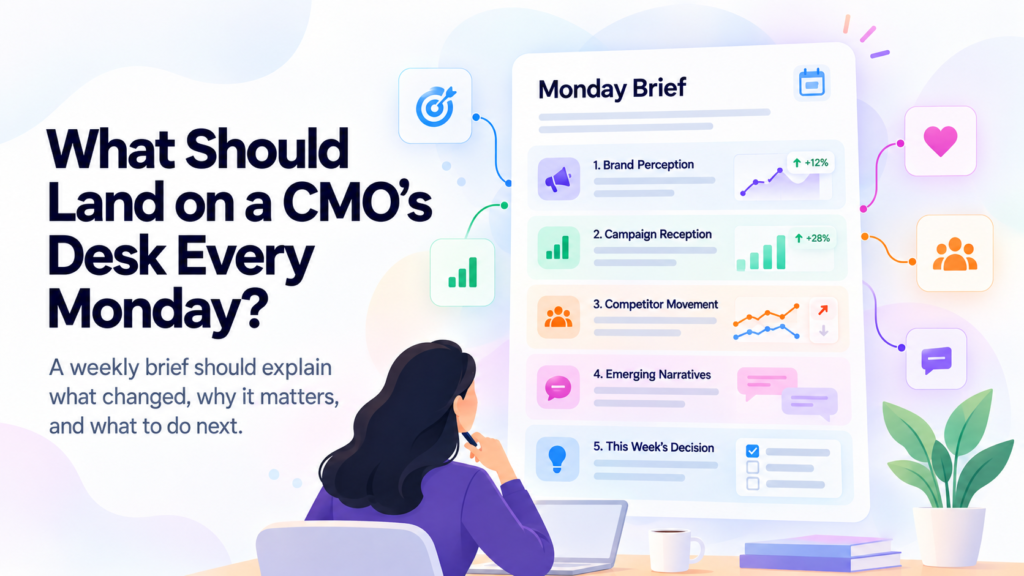
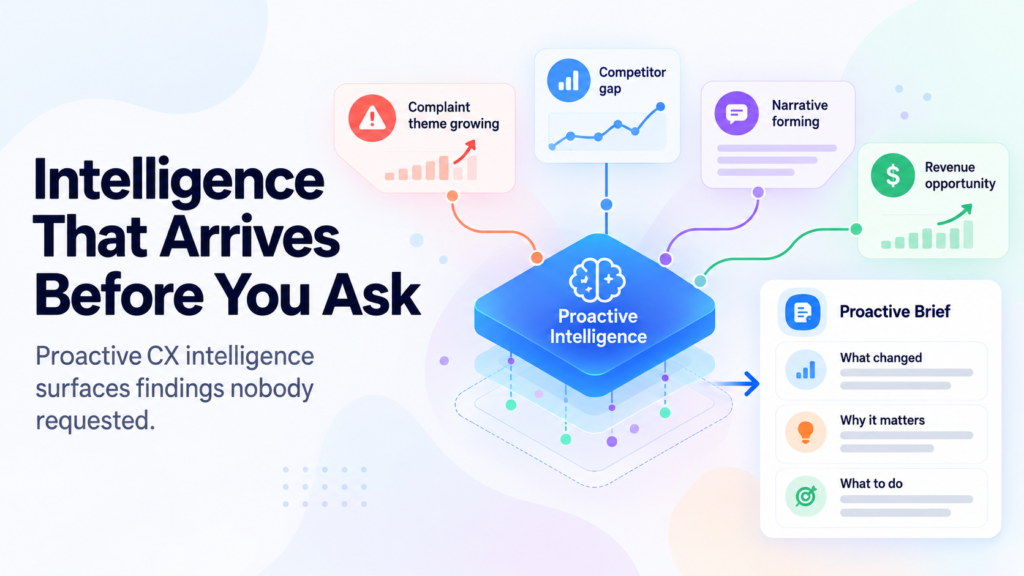
Receive what matters without asking. The highest-value finding is often the one nobody knew to request. A proactive brief carries what changed for that reader, with reasoning.
Keep dashboards where they belong. Operational monitoring, SLA tracking, queue health, agent performance, campaign delivery. A supervisor watching a known process all day needs exactly this, and should keep it. Dashboards did not fail. They were given a job they were never designed for.
How Konnect Insights Approaches It
Konnect Insights builds dashboards and BI tools, including custom charts, and those remain the right tool for operational monitoring. This is worth saying before the rest.
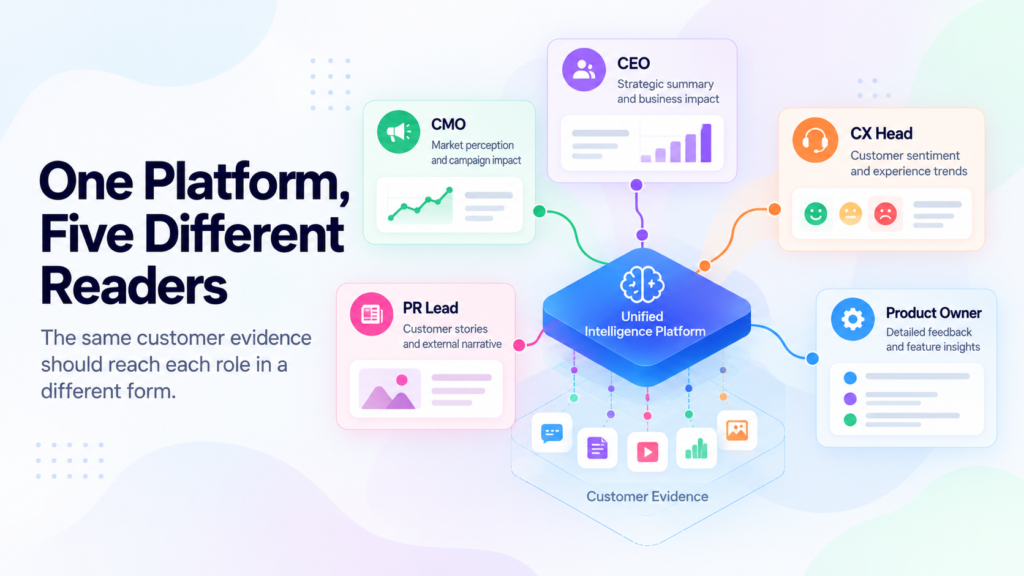
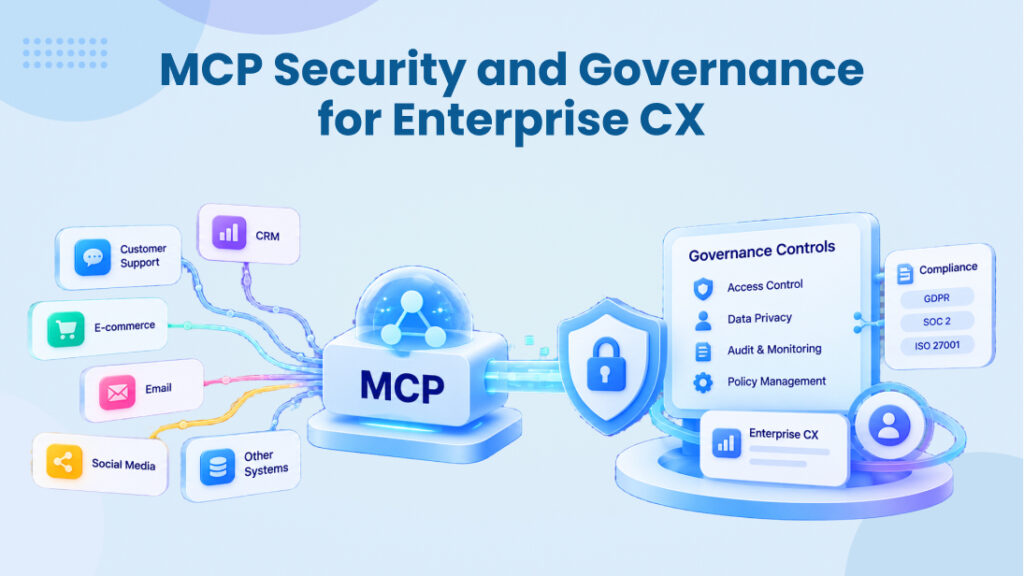
KRC exists because leadership enquiry is a different job. A CEO, CMO or CX head asks in plain language and gets an answer with the customer conversations attached, including the follow-up questions that always matter more than the first one. Through MCP, the enquiry extends into CRM, contact centre and marketing systems, so the answer is not limited to one platform’s data.
Pulse covers the other half, surfacing what changed for a given stakeholder without them having to arrive with a question at all.
The honest framing is that the two layers serve different people. The supervisor keeps the dashboard open all day. The CX head opens it twice a month and should not be judged for that. They were never the user it was built for.
Frequently Asked Questions
Author